Grundlæggende statistik
| Institutionelle ejere | 378 total, 357 long only, 2 short only, 19 long/short - change of -1,20% MRQ |
| Gennemsnitlig porteføljeallokering | 0.5204 % - change of 15,01% MRQ |
| Institutionelle aktier (lange) | 150.406.012 (ex 13D/G) - change of -7,58MM shares -1,62% MRQ |
| Institutionel værdi (lang) | $ 10.481.829 USD ($1000) |
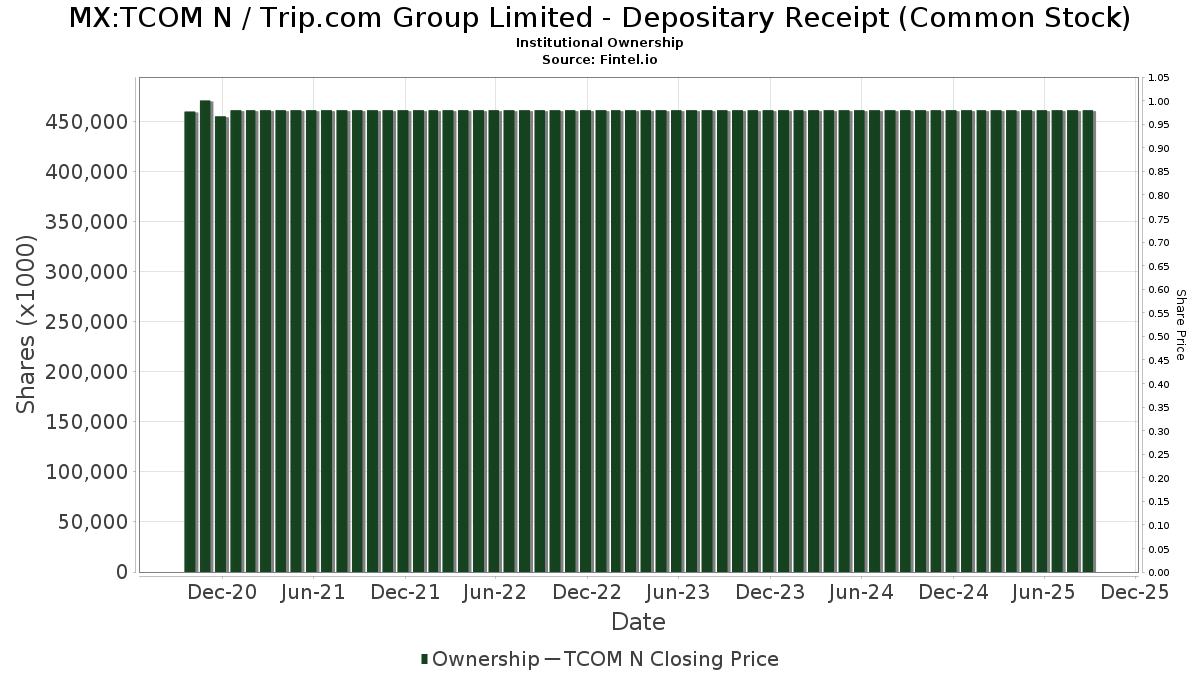
Institutionelt ejerskab og aktionærer
Trip.com Group Limited - Depositary Receipt (Common Stock) (MX:TCOM N) har 378 institutionelle ejere og aktionærer, der har indsendt 13D/G- eller 13F-formularer til Securities Exchange Commission (SEC). Disse institutioner har i alt 150,406,012 aktier. Største aktionærer omfatter Capital World Investors, Morgan Stanley, Sanders Capital, LLC, Capital International Investors, Davis Selected Advisers, Cantillon Capital Management Llc, Jpmorgan Chase & Co, ARGA Investment Management, LP, Fmr Llc, and Legal & General Group Plc .
Trip.com Group Limited - Depositary Receipt (Common Stock) (BMV:TCOM N) institutionel ejerskabsstruktur viser aktuelle positioner i virksomheden efter institutioner og fonde, samt seneste ændringer i positionsstørrelse. Større aktionærer kan omfatte individuelle investorer, investeringsforeninger, hedgefonde eller institutioner. Skema 13D angiver, at investoren besidder (eller besidder) mere end 5 % af virksomheden og har til hensigt (eller har til hensigt at) aktivt at forfølge en ændring i forretningsstrategi. Skema 13G indikerer en passiv investering på over 5%.
Fondens stemningsscore
Fund Sentiment Score (fka Ownership Accumulation Score) finder de aktier, der bliver mest købt af fonde. Det er resultatet af en sofistikeret, multi-faktor kvantitativ model, der identificerer virksomheder med de højeste niveauer af institutionel akkumulering. Scoringsmodellen bruger en kombination af den samlede stigning i oplyste ejere, ændringerne i porteføljeallokeringer i disse ejere og andre målinger. Tallet går fra 0 til 100, hvor højere tal indikerer et højere niveau af akkumulering for sine jævnaldrende, og 50 er gennemsnittet.
Opdateringsfrekvens: Dagligt
Se Ownership Explorer, som giver en liste over højest rangerende virksomheder.
AI+ Ask Fintel’s AI assistant about Trip.com Group Limited - Depositary Receipt (Common Stock).
Select a question to share a public post with an AI-crafted answer.
Thinking of good questions…
13F og NPORT arkivering
Detaljer om 13F-arkivering er gratis. Detaljer om NP-ansøgninger kræver et premium-medlemskab. Grønne rækker angiver nye positioner. Røde rækker angiver lukkede positioner. Klik på linket ikon for at se den fulde transaktionshistorik.
Opgrader
for at låse premium-data op og eksportere til Excel ![]() .
.
| Fil dato | Kilde | Investor | Type | Gennemsnitlig pris (Øst) |
Aktier | Δ Aktier (%) |
Rapporteret Værdi ($1000) |
Δ Værdi (%) |
Port Alloc (%) |
|
|---|---|---|---|---|---|---|---|---|---|---|
| 2025-11-04 | 13F | State of Wyoming | 0 | -100,00 | 0 | |||||
| 2026-01-23 | 13F | Assetmark, Inc | 61.355 | 13,72 | 4.412 | 8,75 | ||||
| 2026-02-13 | 13F | 1832 Asset Management L.P. | 164.170 | 11.805 | ||||||
| 2026-01-29 | 13F | Sanctuary Advisors, LLC | 3.362 | 8,45 | 242 | 3,43 | ||||
| 2026-02-17 | 13F | Credit Agricole S A | 8.372 | 51,26 | 602 | 44,71 | ||||
| 2026-02-02 | 13F | Wolverine Asset Management Llc | Put | 100 | 0,00 | 7 | 0,00 | |||
| 2026-02-11 | 13F | Clearbridge Investments, LLC | 1.103.710 | -3,76 | 79.368 | -7,97 | ||||
| 2026-02-17 | 13F | Tower Research Capital LLC (TRC) | 1.086 | -98,89 | 78 | -98,94 | ||||
| 2026-04-13 | 13F | IFP Advisors, Inc | 1.216 | 61 | ||||||
| 2026-02-06 | 13F | Tredje AP-fonden | 84.019 | 6.042 | ||||||
| 2025-11-06 | 13F | Haven Private, LLC | 0 | -100,00 | 0 | |||||
| 2026-04-10 | 13F | Abound Wealth Management | 1.606 | 0,00 | 80 | -31,30 | ||||
| 2026-02-11 | 13F | Franklin Resources Inc | 3.410 | -95,56 | 245 | -95,76 | ||||
| 2026-02-11 | 13F | O'shaughnessy Asset Management, Llc | 44.468 | 4,99 | 3.198 | 0,38 | ||||
| 2026-02-10 | 13F | Guardcap Asset Management Ltd | 31.130 | -12,38 | 2.239 | -16,21 | ||||
| 2026-02-13 | 13F | Flow Traders U.s. Llc | 19.972 | 1 | ||||||
| 2025-11-14 | 13F | Aspex Management (HK) Ltd | 0 | -100,00 | 0 | |||||
| 2026-02-17 | 13F/A | Northwest & Ethical Investments L.P. | 26.077 | -13,71 | 1.875 | -17,47 | ||||
| 2026-03-03 | 13F/A | Caitong International Asset Management Co., Ltd | 13 | -97,65 | 1 | -100,00 | ||||
| 2025-11-14 | 13F | KEYWISE CAPITAL MANAGEMENT (HK) Ltd | 0 | -100,00 | 0 | |||||
| 2026-04-23 | 13F | Oppenheimer Asset Management Inc. | 13.147 | 352,41 | 655 | 214,42 | ||||
| 2026-01-16 | 13F | Standard Life Aberdeen plc | 26.819 | 0,00 | 1.929 | -4,37 | ||||
| 2026-01-23 | 13F | Factory Mutual Insurance Co | 15.496 | 50,87 | 1.114 | 44,30 | ||||
| 2026-02-12 | 13F | M&G Plc | 221.183 | 42,28 | 15.925 | 36,60 | ||||
| 2025-11-14 | 13F | AXA Investment Managers S.A. | 495.520 | 37.263 | ||||||
| 2026-02-10 | 13F | Bank of New York Mellon Corp | 36.431 | 1,43 | 2.620 | -3,00 | ||||
| 2026-02-17 | 13F | Bayesian Capital Management, LP | 0 | -100,00 | 0 | |||||
| 2026-01-27 | 13F | First Horizon Corp | 361 | 0,00 | 26 | -7,41 | ||||
| 2026-02-17 | 13F | Tudor Investment Corp Et Al | Put | 22.200 | 2,78 | 1.596 | -1,72 | |||
| 2026-02-12 | 13F | DRW Securities, LLC | 25.400 | 1.827 | ||||||
| 2026-02-13 | 13F | BNP Paribas Asset Management Holding S.A. | 442.545 | 32 | ||||||
| 2026-02-17 | 13F | Tudor Investment Corp Et Al | 15.661 | 1.126 | ||||||
| 2026-02-17 | 13F | DZ BANK AG Deutsche Zentral Genossenschafts Bank, Frankfurt am Main | 0 | -100,00 | 0 | |||||
| 2026-02-11 | 13F | Jpmorgan Chase & Co | 4.261.265 | -3,93 | 306.428 | -8,14 | ||||
| 2026-02-13 | 13F | Dodge & Cox | 19.250 | 0,00 | 1.384 | -4,35 | ||||
| 2026-01-08 | 13F | Nordea Investment Management Ab | 580.964 | -8,34 | 41.742 | -12,66 | ||||
| 2026-02-13 | 13F | Motiv8 Investments LLC | 30 | 0 | ||||||
| 2026-02-11 | 13F | Axiom International Investors Llc /de | 0 | -100,00 | 0 | |||||
| 2025-11-14 | 13F | Gluskin Sheff & Assoc Inc | 0 | -100,00 | 0 | |||||
| 2026-02-12 | 13F | BRYN MAWR TRUST Co | 0 | -100,00 | 0 | -100,00 | ||||
| 2026-02-02 | 13F | Davis Selected Advisers | 5.053.389 | 2,27 | 363.389 | -2,21 | ||||
| 2026-01-26 | 13F | Cwm, Llc | 2.443 | 8,00 | 0 | |||||
| 2026-01-29 | 13F | WT Asset Management Ltd | 0 | -100,00 | 0 | |||||
| 2026-02-17 | 13F | Quadrature Capital Ltd | 23.800 | 1.711 | ||||||
| 2025-11-14 | 13F | Mount Yale Investment Advisors, LLC | 0 | -100,00 | 0 | -100,00 | ||||
| 2026-02-06 | 13F | Global Retirement Partners, LLC | 5.835 | 1.998,92 | 420 | 1.995,00 | ||||
| 2026-02-13 | 13F | Cornerstone Financial Management LLC | 37 | 3 | ||||||
| 2026-04-24 | 13F | TT International Asset Management LTD | 24.777 | -45,14 | 1.234 | 41.000,00 | ||||
| 2026-02-13 | 13F | Solstein Capital, LLC | 28.400 | 0,00 | 2.042 | -4,36 | ||||
| 2026-04-09 | 13F | Park Place Capital Corp | 194 | 0,00 | 10 | -30,77 | ||||
| 2026-02-03 | 13F | Denali Advisors Llc | 5.805 | -2,12 | 417 | -6,50 | ||||
| 2026-02-13 | 13F | Verition Fund Management LLC | 41.288 | -39,97 | 2.969 | -42,59 | ||||
| 2026-02-17 | 13F | Trexquant Investment LP | 40.678 | -66,95 | 2.925 | -68,40 | ||||
| 2026-02-04 | 13F | Legacy Financial Advisors, Inc. | 0 | -100,00 | 0 | |||||
| 2026-02-17 | 13F | Hbk Investments L P | Put | 123.600 | 0,00 | 8.888 | -4,37 | |||
| 2026-02-17 | 13F | Amundi | 308.690 | -1,65 | 22.198 | -0,93 | ||||
| 2026-02-17 | 13F | Polar Capital Holdings Plc | 999.029 | -1,53 | 71.840 | -5,84 | ||||
| 2026-02-13 | 13F | Verition Fund Management LLC | Put | 121.200 | 78,76 | 8.715 | 70,95 | |||
| 2026-02-13 | 13F | Verition Fund Management LLC | Call | 90.500 | 86,98 | 6.508 | 78,81 | |||
| 2026-02-12 | 13F | Comgest Global Investors S.a.s. | 11.137 | -9,52 | 801 | -13,51 | ||||
| 2026-02-17 | 13F | Engineers Gate Manager LP | 44.580 | 3.206 | ||||||
| 2026-01-13 | 13F | Dakota Wealth Management | 7.895 | 6,04 | 568 | 1,43 | ||||
| 2026-02-12 | 13F | Rossby Financial, LCC | 37 | 0,00 | 3 | 0,00 | ||||
| 2026-02-13 | 13F | Kestra Advisory Services, LLC | 2.391 | 172 | ||||||
| 2026-02-17 | 13F | Royal Bank Of Canada | 51.917 | 63,11 | 3.732 | 55,82 | ||||
| 2026-02-10 | 13F | Bnp Paribas Arbitrage, Sa | 14.315 | -22,49 | 1.029 | -25,86 | ||||
| 2026-02-17 | 13F | D. E. Shaw & Co., Inc. | Put | 0 | -100,00 | 0 | ||||
| 2025-11-06 | 13F | Whipplewood Advisors, LLC | 0 | -100,00 | 0 | -100,00 | ||||
| 2026-02-13 | 13F | Citigroup Inc | 264.218 | 116,35 | 19.000 | 106,89 | ||||
| 2026-02-13 | 13F | Citigroup Inc | Call | 20.000 | 0,00 | 1.438 | -4,39 | |||
| 2026-02-17 | 13F | CoreView Capital Management Ltd | 1.928.590 | 0,00 | 138.685 | -4,37 | ||||
| 2026-02-11 | 13F | Lyell Wealth Management, Lp | 5.145 | 3,46 | 370 | -1,07 | ||||
| 2026-02-13 | 13F | Citigroup Inc | Put | 30.000 | 0,00 | 2.157 | -4,39 | |||
| 2026-02-17 | 13F | LMR Partners LLP | Call | 2.900 | 0,00 | 209 | -4,59 | |||
| 2026-04-15 | 13F | Generali Investments CEE, investicni spolecnost, a.s. | 7.863 | 0,00 | 391 | -30,80 | ||||
| 2026-01-27 | 13F | Zurcher Kantonalbank (Zurich Cantonalbank) | 0 | -100,00 | 0 | |||||
| 2026-02-13 | 13F | JustInvest LLC | 17.810 | 11,16 | 1.281 | 6,31 | ||||
| 2026-04-21 | 13F | Maseco Llp | 18 | 0,00 | 1 | -100,00 | ||||
| 2026-02-11 | 13F | OneAscent Investment Solutions LLC | 8.932 | 0,00 | 642 | -4,32 | ||||
| 2026-02-17 | 13F | Guggenheim Capital Llc | 5.886 | -36,37 | 423 | -39,14 | ||||
| 2026-02-17 | 13F | SRS Investment Management, LLC | 756.185 | 0,00 | 54.377 | -4,38 | ||||
| 2026-04-13 | 13F | True Wealth Design, LLC | 45 | 2,27 | 2 | -33,33 | ||||
| 2026-02-17 | 13F | Lazard Asset Management Llc | 819.943 | 20,87 | 58.962 | 15,58 | ||||
| 2026-02-11 | 13F | Cantillon Capital Management Llc | 4.669.778 | 1,38 | 335.804 | -3,05 | ||||
| 2026-01-28 | 13F | CAPROCK Group, Inc. | 7.689 | -1,35 | 553 | -3,83 | ||||
| 2026-04-08 | 13F | DiNuzzo Private Wealth, Inc. | 2 | -86,67 | 0 | |||||
| 2026-02-10 | 13F | Bnp Paribas Arbitrage, Sa | Put | 342 | 2.459 | |||||
| 2026-02-10 | 13F | Bnp Paribas Arbitrage, Sa | Call | 140 | 1.007 | |||||
| 2026-02-13 | 13F | MAI Capital Management | 89 | 0,00 | 6 | 0,00 | ||||
| 2026-02-12 | 13F | Qtron Investments LLC | 0 | -100,00 | 0 | |||||
| 2026-02-13 | 13F | Walleye Trading LLC | Call | 150.600 | 168,93 | 10.830 | 157,16 | |||
| 2026-02-11 | 13F | Ramirez Asset Management, Inc. | 57.480 | 4.133 | ||||||
| 2026-02-13 | 13F | Walleye Trading LLC | 18.667 | -84,85 | 1.342 | -85,51 | ||||
| 2025-11-14 | 13F | Centiva Capital, LP | 0 | -100,00 | 0 | |||||
| 2026-02-12 | 13F | BlackRock, Inc. | 2.421.784 | 69,73 | 174.151 | 62,31 | ||||
| 2026-04-23 | 13F | North Star Investment Management Corp. | 17 | -63,83 | 1 | -100,00 | ||||
| 2026-02-13 | 13F | Walleye Trading LLC | Put | 182.200 | 58,85 | 13.102 | 51,91 | |||
| 2026-02-13 | 13F | Walleye Capital LLC | Put | 12.300 | 151,02 | 884 | 140,22 | |||
| 2026-02-18 | 13F | GWM Advisors LLC | 6.938 | 26,74 | 499 | 21,17 | ||||
| 2026-02-13 | 13F | Walleye Capital LLC | 12.213 | 878 | ||||||
| 2026-02-17 | 13F | Par Capital Management Inc | 4.500 | 324 | ||||||
| 2026-02-13 | 13F | Walleye Capital LLC | Call | 71.800 | 1.004,62 | 5.163 | 957,99 | |||
| 2026-02-13 | 13F | Wells Fargo & Company/mn | 40.107 | 3,91 | 2.884 | -0,62 | ||||
| 2026-02-12 | 13F | Ci Investments Inc. | 107.201 | -9,26 | 7.709 | 96.250,00 | ||||
| 2026-01-30 | 13F | Mitsubishi UFJ Trust & Banking Corp | 0 | -100,00 | 0 | |||||
| 2026-02-17 | 13F | Two Sigma Advisers, Lp | 655.400 | 48,08 | 47.130 | 41,60 | ||||
| 2025-11-14 | 13F | Maverick Capital Ltd | 0 | -100,00 | 0 | |||||
| 2026-02-10 | 13F | Main Management ETF Advisors, LLC | 18.009 | 1,03 | 1 | 0,00 | ||||
| 2026-02-12 | 13F | Renaissance Technologies Llc | 236.712 | -2,55 | 17.022 | -6,82 | ||||
| 2026-02-13 | 13F | Sculptor Capital LP | Put | 88.700 | 0,00 | 6.378 | -4,38 | |||
| 2026-02-13 | 13F | Schroder Investment Management Group | 1.244.742 | -12,18 | 89.509 | -16,02 | ||||
| 2026-04-22 | 13F | Stone House Investment Management, LLC | 16 | 1 | ||||||
| 2026-02-02 | 13F | Truist Financial Corp | 9.306 | -13,48 | 669 | -17,20 | ||||
| 2025-11-14 | 13F | Scientech Research LLC | 0 | -100,00 | 0 | |||||
| 2026-01-30 | 13F/A | M&t Bank Corp | 36.018 | 2.590 | ||||||
| 2026-02-13 | 13F | SRS Capital Advisors, Inc. | 1.559 | 850,61 | 112 | 833,33 | ||||
| 2026-02-02 | 13F | Wolverine Asset Management Llc | Call | 23.200 | 1.668 | |||||
| 2026-02-13 | 13F | Macquarie Group Ltd | 51.419 | -94,33 | 3.698 | -94,58 | ||||
| 2026-02-11 | 13F | LPL Financial LLC | 56.241 | 6,11 | 4.044 | 1,48 | ||||
| 2026-02-17 | 13F | Price T Rowe Associates Inc /md/ | 8.188 | -18,12 | 1 | |||||
| 2026-02-03 | 13F | Manning & Napier Advisors Llc | 0 | -100,00 | 0 | |||||
| 2026-02-06 | 13F | Profund Advisors Llc | 37.006 | -9,72 | 2.661 | -13,66 | ||||
| 2026-02-17 | 13F | Janus Henderson Group Plc | 1.592.109 | -2,59 | 114.456 | -6,87 | ||||
| 2025-12-18 | 13F | Danske Bank A/s | 0 | -100,00 | 0 | |||||
| 2026-01-23 | 13F | Bridgewater Advisors Inc. | 3.821 | -0,39 | 237 | -11,57 | ||||
| 2026-04-20 | 13F | Ritholtz Wealth Management | 12.511 | -18,25 | 623 | -43,45 | ||||
| 2026-02-17 | 13F | Wellington Management Group Llp | 0 | -100,00 | 0 | |||||
| 2026-01-23 | 13F | Sumitomo Mitsui Trust Holdings, Inc. | 6.936 | -34,60 | 499 | -37,52 | ||||
| 2026-02-13 | 13F | Clarity Asset Management, Inc. | 1.835 | 0,00 | 132 | -5,07 | ||||
| 2026-02-13 | 13F | QVT Financial LP | 2.867 | 0,00 | 206 | -4,19 | ||||
| 2026-02-17 | 13F | Mercer Global Advisors Inc /adv | 6.248 | -3,00 | 449 | -7,23 | ||||
| 2026-02-12 | 13F | Hrt Financial Lp | 0 | -100,00 | 0 | |||||
| 2026-02-13 | 13F | Rhumbline Advisers | 4.179 | -5,45 | 301 | -9,64 | ||||
| 2026-04-16 | 13F | SG Americas Securities, LLC | 64.904 | 381,84 | 3 | |||||
| 2025-11-14 | 13F | Atom Investors LP | 0 | -100,00 | 0 | |||||
| 2026-02-05 | 13F | Bank Julius Baer & Co. Ltd, Zurich | 14.460 | 721,59 | 1.040 | 687,12 | ||||
| 2025-11-18 | 13F | Dorsey Wright & Associates | 0 | -100,00 | 0 | |||||
| 2026-02-17 | 13F | Ameriprise Financial Inc | 724.843 | -8,62 | 52.124 | -12,59 | ||||
| 2025-11-14 | 13F | Wolverine Trading, Llc | 4.853 | -24,58 | 370 | -2,12 | ||||
| 2025-11-14 | 13F | Wolverine Trading, Llc | Call | 31.000 | 7,64 | 2.360 | 39,73 | |||
| 2026-04-07 | 13F | Farther Finance Advisors, LLC | 3.130 | 68,46 | 156 | 16,54 | ||||
| 2026-02-03 | 13F | Mitsubishi UFJ Kokusai Asset Management Co., Ltd. | 14.950 | 0,00 | 1.114 | -0,98 | ||||
| 2025-11-14 | 13F | Wolverine Trading, Llc | Put | 19.000 | -51,53 | 1.447 | -37,10 | |||
| 2026-02-09 | 13F | Huntington National Bank | 1 | 0,00 | 0 | |||||
| 2026-02-13 | 13F | Parkside Financial Bank & Trust | 27 | 0,00 | 2 | -50,00 | ||||
| 2026-02-06 | 13F | Fairtree Asset Management (Pty) Ltd | 25.189 | 65,33 | 1.811 | 58,17 | ||||
| 2026-02-17 | 13F | D. E. Shaw & Co., Inc. | Call | 69.400 | 1.635,00 | 4.991 | 1.563,33 | |||
| 2026-04-24 | 13F | Yousif Capital Management, Llc | 10.776 | 0,00 | 537 | -17,67 | ||||
| 2026-02-17 | 13F | Amussen Hunsaker Associates Llc | 2.830 | 0,00 | 204 | -4,69 | ||||
| 2026-01-30 | 13F | Us Bancorp \de\ | 13.341 | -7,51 | 959 | -11,53 | ||||
| 2026-02-12 | 13F | Advisors Asset Management, Inc. | 3.523 | 20,28 | 253 | 15,00 | ||||
| 2026-02-17 | 13F | Two Sigma Securities, Llc | 3.079 | -37,70 | 221 | -40,43 | ||||
| 2026-02-17 | 13F | Quantinno Capital Management LP | 47.952 | 20,95 | 3.448 | 15,67 | ||||
| 2026-01-29 | 13F | Matthews International Capital Management Llc | 271.342 | -30,09 | 19.512 | -33,15 | ||||
| 2026-02-17 | 13F | Sig Brokerage, Lp | 3.501 | 16,82 | 252 | 11,56 | ||||
| 2026-04-08 | 13F | Wealth Enhancement Advisory Services, Llc | 5.438 | -11,52 | 275 | -41,33 | ||||
| 2025-11-12 | 13F | NewSquare Capital LLC | 0 | -100,00 | 0 | |||||
| 2026-02-12 | 13F | Dimensional Fund Advisors Lp | 2.378.366 | -0,02 | 171.028 | -4,39 | ||||
| 2026-02-09 | 13F | William Blair Investment Management, Llc | 22.142 | -4,92 | 1.592 | -9,08 | ||||
| 2026-02-12 | 13F | Alps Advisors Inc | 21.915 | -6,96 | 1.576 | -11,07 | ||||
| 2025-11-14 | 13F | Natixis | 0 | -100,00 | 0 | -100,00 | ||||
| 2026-02-17 | 13F | ExodusPoint Capital Management, LP | 0 | -100,00 | 0 | -100,00 | ||||
| 2026-03-12 | 13F/A | Peak6 Llc | Put | 42.400 | 244,72 | 3.049 | 229,87 | |||
| 2026-03-12 | 13F/A | Peak6 Llc | Call | 148.200 | -0,74 | 10.657 | -5,08 | |||
| 2026-02-17 | 13F | Dark Forest Capital Management Lp | 0 | -100,00 | 0 | -100,00 | ||||
| 2026-02-17 | 13F | Northern Trust Corp | 653.851 | 7,33 | 47.018 | 2,63 | ||||
| 2026-02-17 | 13F | D. E. Shaw & Co., Inc. | 849.904 | 25,43 | 61.117 | 19,94 | ||||
| 2026-01-28 | 13F | DekaBank Deutsche Girozentrale | 405.000 | 0,00 | 22 | -30,00 | ||||
| 2026-02-13 | 13F | Dymon Asia Capital (singapore) Pte. Ltd. | 0 | -100,00 | 0 | |||||
| 2026-02-05 | 13F | AustralianSuper Pty Ltd | 467.579 | 58,67 | 33.624 | 51,73 | ||||
| 2026-01-27 | 13F | Osborne Partners Capital Management, Llc | 175.820 | 21,93 | 12.643 | 16,60 | ||||
| 2025-11-12 | 13F | Cambridge Investment Research Advisors, Inc. | 0 | -100,00 | 0 | |||||
| 2026-01-29 | 13F | IMC-Chicago, LLC | Call | 193.000 | -1,63 | 13.879 | -5,94 | |||
| 2026-01-30 | 13F | ARGA Investment Management, LP | 3.944.185 | -14,81 | 283.626 | -18,54 | ||||
| 2026-02-13 | 13F | Pinpoint Asset Management (Singapore) Pte. Ltd. | 206.366 | 14.840 | ||||||
| 2025-11-14 | 13F | Parallax Volatility Advisers, L.P. | Put | 0 | -100,00 | 0 | -100,00 | |||
| 2025-11-14 | 13F | Parallax Volatility Advisers, L.P. | 0 | -100,00 | 0 | -100,00 | ||||
| 2026-02-11 | 13F | Capital International Sarl | 645.243 | -19,70 | 46.399 | -23,21 | ||||
| 2026-02-13 | 13F | American Century Companies Inc | 298.962 | 0,87 | 21.498 | -3,55 | ||||
| 2026-01-29 | 13F | Rakuten Securities, Inc. | 0 | -100,00 | 0 | |||||
| 2026-02-17 | 13F | Persistent Asset Partners Ltd | 2.434 | 175 | ||||||
| 2026-04-16 | 13F | TB Alternative Assets Ltd. | 325.920 | 260,85 | 16.228 | 149,88 | ||||
| 2026-02-17 | 13F | Man Group plc | 341.600 | -65,82 | 24.564 | -67,32 | ||||
| 2026-02-17 | 13F | United Capital Financial Advisers, Llc | 0 | -100,00 | 0 | |||||
| 2026-02-09 | 13F | Hantz Financial Services, Inc. | 11.456 | 44,56 | 1 | |||||
| 2026-02-13 | 13F/A | Alberta Investment Management Corp | 0 | -100,00 | 0 | -100,00 | ||||
| 2026-02-13 | 13F | Ubs Asset Management Americas Inc | 4.105 | 295 | ||||||
| 2026-01-28 | 13F | U S Global Investors Inc | 113.885 | 8,96 | 8.189 | 4,20 | ||||
| 2026-01-29 | 13F | UBS Group AG | Put | 92.600 | -77,93 | 6.659 | -78,90 | |||
| 2026-02-03 | 13F | SBI Securities Co., Ltd. | 965 | 1,47 | 69 | -2,82 | ||||
| 2026-01-29 | 13F | UBS Group AG | Call | 212.200 | -27,01 | 15.259 | -30,21 | |||
| 2026-02-13 | 13F | Toroso Investments, LLC | 19.529 | -36,98 | 1.404 | -39,74 | ||||
| 2026-01-29 | 13F | UBS Group AG | 2.094.219 | 3,41 | 150.595 | -1,11 | ||||
| 2026-02-17 | 13F | Jump Financial, LLC | 173.500 | 297,13 | 12.476 | 279,79 | ||||
| 2026-02-17 | 13F | Linden Advisors Lp | 0 | -100,00 | 0 | -100,00 | ||||
| 2026-02-13 | 13F | Aigen Investment Management, Lp | 0 | -100,00 | 0 | |||||
| 2026-02-12 | 13F | Loomis Sayles & Co L P | 873.787 | -0,81 | 62.834 | -5,15 | ||||
| 2026-02-17 | 13F | HighVista Strategies LLC | 10.646 | 9,12 | 766 | 4,37 | ||||
| 2026-02-09 | 13F | Legal & General Group Plc | 2.666.701 | -14,40 | 191.696 | -18,16 | ||||
| 2026-02-05 | 13F | Baader Bank INC | 30.078 | 2.161 | ||||||
| 2026-02-02 | 13F | Qrg Capital Management, Inc. | 12.867 | 2,82 | 925 | -1,70 | ||||
| 2026-02-18 | 13F/A | Empowered Funds, LLC | 3.327 | 239 | ||||||
| 2026-02-14 | 13F | Rockefeller Capital Management L.P. | 233.601 | 4,80 | 16.798 | 0,21 | ||||
| 2026-02-13 | 13F | Neuberger Berman Group LLC | 27.692 | 288,39 | 1.991 | 271,46 | ||||
| 2026-02-17 | 13F | CastleKnight Management LP | 3.500 | 0,00 | 252 | -4,56 | ||||
| 2026-02-17 | 13F | LMR Partners LLP | 0 | -100,00 | 0 | |||||
| 2026-02-13 | 13F | Morgan Stanley | 16.377.936 | -11,80 | 1.177.737 | -15,65 | ||||
| 2026-02-19 | 13F | CI Private Wealth, LLC | 9.783 | -2,46 | 693 | -8,09 | ||||
| 2025-11-14 | 13F | Wetherby Asset Management Inc | 16.263 | -0,26 | 1.223 | 27,82 | ||||
| 2026-03-03 | 13F/A | Ovata Capital Management Ltd | 111.412 | 35,34 | 7.930 | 25,75 | ||||
| 2026-02-05 | 13F | Allworth Financial LP | 2.104 | -2,32 | 151 | -6,21 | ||||
| 2026-02-17 | 13F | MIRAE ASSET GLOBAL ETFS HOLDINGS Ltd. | 32.947 | -12,75 | 2.369 | -16,56 | ||||
| 2026-04-17 | 13F | CENTRAL TRUST Co | 86 | 0,00 | 4 | -33,33 | ||||
| 2026-04-21 | 13F | PDS Planning, Inc | 0 | -100,00 | 0 | |||||
| 2026-01-27 | 13F | Asset Management One Co., Ltd. | 141.865 | 0,00 | 10.301 | -3,45 | ||||
| 2026-03-06 | 13F | Hsbc Holdings Plc | 73.747 | 544,13 | 5.280 | 513,24 | ||||
| 2026-04-17 | 13F | Bell Investment Advisors, Inc | 157 | 157,38 | 8 | 75,00 | ||||
| 2025-11-14 | 13F | Arrowpoint Investment Partners (Singapore) Pte. Ltd. | 0 | -100,00 | 0 | -100,00 | ||||
| 2026-04-02 | 13F | Ares Financial Consulting, LLC | 22 | 0,00 | 1 | 0,00 | ||||
| 2026-02-17 | 13F | Lighthouse Investment Partners, LLC | 46.631 | 3.353 | ||||||
| 2026-02-13 | 13F | Polymer Capital Management (HK) LTD | 65.500 | 4.710 | ||||||
| 2026-02-03 | 13F | Ethic Inc. | 42.193 | 10,09 | 3.034 | 5,27 | ||||
| 2026-02-04 | 13F | Aubrey Capital Management Ltd | 181.200 | 6,28 | 13.030 | 1,62 | ||||
| 2025-11-10 | 13F | Nkcfo Llc | 0 | -100,00 | 0 | |||||
| 2026-02-13 | 13F | Sei Investments Co | 296.780 | 11,60 | 21.341 | 6,72 | ||||
| 2026-02-17 | 13F | Cape Investment Advisory, Inc. | 77 | 1,32 | 6 | 0,00 | ||||
| 2026-01-29 | 13F | China Universal Asset Management Co., Ltd. | 47.685 | 38,22 | 3.429 | 32,19 | ||||
| 2026-02-13 | 13F | Y-Intercept (Hong Kong) Ltd | 37.593 | 2.703 | ||||||
| 2026-02-17 | 13F | Public Employees Retirement System Of Ohio | 135.219 | 0,00 | 9.724 | -4,38 | ||||
| 2026-01-22 | 13F | Massachusetts Financial Services Co /ma/ | 31.507 | -8,99 | 2.266 | -12,99 | ||||
| 2026-02-17 | 13F | Voloridge Investment Management, Llc | 190.501 | -70,32 | 13.699 | -71,62 | ||||
| 2026-02-19 | 13F | Atomi Financial Group, Inc. | 10.067 | 11,58 | 724 | 6,64 | ||||
| 2026-02-11 | 13F | Brandes Investment Partners, Lp | 29.900 | 2.150 | ||||||
| 2026-02-11 | 13F | Capital World Investors | 32.809.848 | -13,40 | 2.359.416 | -17,19 | ||||
| 2026-04-02 | 13F | Marex Group plc | 0 | -100,00 | 0 | -100,00 | ||||
| 2026-04-13 | 13F | Salem Investment Counselors Inc | 6 | 0 | ||||||
| 2026-01-08 | 13F | Tuttle Tactical Management LLC | 3.645 | 262 | ||||||
| 2026-04-16 | 13F | SG Americas Securities, LLC | Call | 0 | -100,00 | 0 | ||||
| 2026-02-17 | 13F | Creative Planning | 28.898 | -0,20 | 2.078 | -4,55 | ||||
| 2026-04-06 | 13F | Versant Capital Management, Inc | 25 | 1 | ||||||
| 2026-04-08 | 13F | Wealth Science Advisors LLC | 31 | 2 | ||||||
| 2025-11-13 | 13F | Monolith Management Ltd | 0 | -100,00 | 0 | |||||
| 2026-02-13 | 13F | Sanders Capital, LLC | 9.890.637 | 0,23 | 711.236 | -4,16 | ||||
| 2025-11-04 | 13F | IMC-Chicago, LLC | 0 | -100,00 | 0 | -100,00 | ||||
| 2026-02-13 | 13F | Causeway Capital Management Llc | 0 | -100,00 | 0 | |||||
| 2026-01-26 | 13F | Private Trust Co Na | 16 | 0,00 | 1 | 0,00 | ||||
| 2026-04-15 | 13F | Bayforest Capital Ltd | 3.210 | -20,58 | 160 | -45,17 | ||||
| 2026-02-09 | 13F | Geode Capital Management, Llc | 206.422 | -8,66 | 14.844 | -12,66 | ||||
| 2026-02-13 | 13F | Acumen Wealth Advisors, LLC | 71 | 5 | ||||||
| 2026-04-15 | 13F | Capital Advisory Group Advisory Services, LLC | 0 | -100,00 | 0 | |||||
| 2026-02-12 | 13F | Campbell & CO Investment Adviser LLC | 88.874 | 6.391 | ||||||
| 2026-02-14 | 13F | Triata Capital Ltd | 343.893 | 28,27 | 24.729 | 22,66 | ||||
| 2026-02-13 | 13F | Platinum Investment Management Ltd | 443.718 | -6,41 | 31.908 | -10,51 | ||||
| 2026-02-17 | 13F | Laird Norton Trust Company, Llc | 23.524 | 1.692 | ||||||
| 2026-02-10 | 13F | Goldman Sachs Group Inc | Call | 100.000 | 0,00 | 7.191 | -4,37 | |||
| 2026-02-10 | 13F | Goldman Sachs Group Inc | Put | 100.000 | 0,00 | 7.191 | -4,37 | |||
| 2026-02-10 | 13F | Goldman Sachs Group Inc | 1.215.634 | 13,06 | 87.416 | 8,11 | ||||
| 2026-02-11 | 13F | Capital International Investors | 6.220.441 | -2,49 | 447.324 | -6,76 | ||||
| 2026-02-13 | 13F | Allianz Se | 1.825 | 0,00 | 131 | -4,38 | ||||
| 2026-02-17 | 13F | Balyasny Asset Management Llc | Call | 16.200 | 295,12 | 1.165 | 277,92 | |||
| 2026-02-17 | 13F | Bank Of America Corp /de/ | 680.150 | -0,75 | 48.910 | -5,09 | ||||
| 2026-02-17 | 13F | Balyasny Asset Management Llc | Put | 38.100 | 337,93 | 2.740 | 318,81 | |||
| 2026-02-12 | 13F | Brinker Capital Investments, LLC | 10.887 | 64,48 | 783 | 57,34 | ||||
| 2026-02-17 | 13F | Balyasny Asset Management Llc | 61.678 | 4.435 | ||||||
| 2025-11-04 | 13F | Allianz Asset Management GmbH | 0 | -100,00 | 0 | |||||
| 2025-11-10 | 13F | Greenwoods Asset Management Hong Kong Ltd. | 0 | -100,00 | 0 | |||||
| 2026-02-17 | 13F | GAM Holding AG | 32.024 | 67,39 | 2.303 | 60,08 | ||||
| 2026-01-15 | 13F | Nisa Investment Advisors, Llc | 367 | 22,33 | 26 | 18,18 | ||||
| 2026-01-26 | 13F | Mirae Asset Global Investments Co., Ltd. | 97.856 | -9,49 | 7.037 | -13,46 | ||||
| 2026-04-07 | 13F | Park Avenue Securities Llc | 0 | -100,00 | 0 | |||||
| 2026-02-13 | 13F | National Bank Of Canada /fi/ | 178.889 | -61,48 | 12.864 | -63,16 | ||||
| 2026-02-13 | 13F | Wealth Alliance | 3.391 | -6,92 | 244 | -10,99 | ||||
| 2026-02-17 | 13F | Ancora Advisors, LLC | 22 | 2 | ||||||
| 2025-11-13 | 13F | Total Investment Management Inc | 0 | -100,00 | 0 | |||||
| 2026-02-12 | 13F | Commonwealth Equity Services, Llc | 3.826 | 2,33 | 275 | |||||
| 2026-02-18 | 13F | Vident Advisory, LLC | 19.593 | 13,91 | 1.409 | 8,89 | ||||
| 2026-01-22 | 13F | BOCHK Asset Management Ltd | 13.563 | 473,97 | 975 | 450,85 | ||||
| 2026-02-13 | 13F | Mml Investors Services, Llc | 13.293 | 7,70 | 956 | 2,91 | ||||
| 2026-02-10 | 13F | Daiwa Securities Group Inc. | 13.800 | -23,69 | 1 | -100,00 | ||||
| 2026-02-17 | 13F | XTX Topco Ltd | 27.365 | 47,16 | 1.968 | 40,70 | ||||
| 2026-02-13 | 13F | First Trust Advisors Lp | 5.989 | -4,34 | 431 | -8,51 | ||||
| 2026-02-13 | 13F | Vontobel Holding Ltd. | 1.265.598 | -3,05 | 91.009 | -7,29 | ||||
| 2025-10-31 | 13F | Whittier Trust Co | 0 | -100,00 | 0 | |||||
| 2026-04-24 | 13F | Abacus Wealth Partners, LLC | 10.638 | 16,22 | 530 | -19,60 | ||||
| 2026-01-28 | 13F | Migdal Insurance & Financial Holdings Ltd. | 1.765 | 0,00 | 0 | |||||
| 2026-02-12 | 13F | Barometer Capital Management Inc. | 0 | -100,00 | 0 | |||||
| 2025-11-14 | 13F | Peak6 Llc | 0 | -100,00 | 0 | -100,00 | ||||
| 2025-10-28 | 13F | Richardson Financial Services Inc. | 0 | -100,00 | 0 | |||||
| 2026-04-22 | 13F | Pinnacle Bancorp, Inc. | 198 | 10 | ||||||
| 2026-02-17 | 13F | Raymond James Financial Inc | 59.592 | 14,72 | 4.289 | 9,81 | ||||
| 2026-02-17 | 13F | Advisor Group Holdings, Inc. | 11.542 | -48,79 | 830 | -50,65 | ||||
| 2026-02-13 | 13F | Atlas Capital Advisors Llc | 3.322 | 0,24 | 239 | 22,68 | ||||
| 2025-11-14 | 13F | Qube Research & Technologies Ltd | Call | 0 | -100,00 | 0 | -100,00 | |||
| 2026-04-17 | 13F | Ambassador Advisors, LLC | 0 | -100,00 | 0 | |||||
| 2026-02-17 | 13F | Russell Investments Group, Ltd. | 2.042.570 | -4,14 | 146.887 | -8,34 | ||||
| 2026-02-18 | 13F | VGI Partners Ltd | 0 | -100,00 | 0 | |||||
| 2026-02-13 | 13F | Hel Ved Capital Management Ltd | 0 | -100,00 | 0 | |||||
| 2026-02-13 | 13F | Marshall Wace, Llp | 0 | -100,00 | 0 | |||||
| 2026-02-17 | 13F | SIH Partners, LLLP | 317.850 | -2,59 | 22.857 | -6,85 | ||||
| 2026-02-11 | 13F | Trivest Advisors Ltd | 507.000 | -53,91 | 36.458 | -55,93 | ||||
| 2026-02-13 | 13F | Mariner, LLC | 12.295 | 5,02 | 885 | 0,45 | ||||
| 2026-02-13 | 13F | Marshall Wace, Llp | Put | 0 | -100,00 | 0 | ||||
| 2026-02-09 | 13F | Wcm Investment Management, Llc | 3.285 | 3,11 | 238 | -2,07 | ||||
| 2026-02-09 | 13F | Frazier Financial Advisors, LLC | 100 | 7 | ||||||
| 2026-01-15 | 13F | Allspring Global Investments Holdings, LLC | 3.786 | 282 | ||||||
| 2026-01-30 | 13F | Jennison Associates Llc | 369.952 | -26,30 | 26.603 | -29,52 | ||||
| 2026-02-10 | 13F | Nomura Asset Management Co Ltd | 41.360 | 0,00 | 2.974 | -4,37 | ||||
| 2026-02-17 | 13F | Optiver Holding B.V. | 5 | 0 | ||||||
| 2025-11-12 | 13F | Group One Trading, L.p. | 0 | -100,00 | 0 | -100,00 | ||||
| 2025-11-14 | 13F | Squarepoint Ops LLC | Call | 0 | -100,00 | 0 | -100,00 | |||
| 2026-04-24 | 13F | UMA Financial Services, Inc. | 231 | 0,00 | 12 | -31,25 | ||||
| 2026-02-12 | 13F | Callan Family Office, LLC | 10.688 | 60,53 | 769 | 53,60 | ||||
| 2026-02-05 | 13F/A | Delta Accumulation, LLC | 20 | 0,00 | 1 | 0,00 | ||||
| 2026-02-12 | 13F | Federation des caisses Desjardins du Quebec | 14.062 | -3,40 | 1.011 | -7,67 | ||||
| 2026-02-06 | 13F | Cullen/frost Bankers, Inc. | 4 | 0,00 | 0 | |||||
| 2026-02-09 | 13F | Harbour Investments, Inc. | 249 | 0,00 | 18 | -5,56 | ||||
| 2026-02-05 | 13F | Atria Investments Llc | 4.136 | -4,21 | 297 | -8,33 | ||||
| 2026-02-10 | 13F | Natixis Advisors, L.p. | 67.335 | 17,76 | 5 | 0,00 | ||||
| 2026-02-06 | 13F | HighTower Advisors, LLC | 73.983 | 1,92 | 5.320 | -2,53 | ||||
| 2025-11-12 | 13F | CIBC Bancorp USA Inc. | 757.695 | 56.979 | ||||||
| 2026-02-13 | 13F | State Street Corp | 19.925 | -77,57 | 1.433 | -78,57 | ||||
| 2026-02-11 | 13F | Deutsche Bank Ag\ | 29.652 | -0,69 | 2.132 | -5,03 | ||||
| 2026-02-17 | 13F | Point72 Asset Management, L.P. | Put | 28.100 | 0,00 | 2.021 | -4,40 | |||
| 2026-04-15 | 13F | Gf Fund Management Co. Ltd. | 2.500 | 124 | ||||||
| 2026-02-17 | 13F | Two Sigma Investments, Lp | 377.363 | 4.931,51 | 27.136 | 4.711,35 | ||||
| 2025-11-12 | 13F | Bellwether Advisors, LLC | 0 | -100,00 | 0 | |||||
| 2026-02-10 | 13F | Envestnet Asset Management Inc | 131.950 | -1,69 | 9.488 | -5,99 | ||||
| 2026-02-23 | 13F | Virtu Financial LLC | 0 | -100,00 | 0 | |||||
| 2026-01-28 | 13F | B. Metzler seel. Sohn & Co. AG | 26.526 | 53,93 | 1.907 | 47,26 | ||||
| 2026-02-17 | 13F | Edmond De Rothschild Holding S.a. | 44.772 | 0,00 | 3.220 | -4,37 | ||||
| 2026-02-13 | 13F | Baldwin Investment Management, LLC | 9.442 | 0,00 | 679 | -4,51 | ||||
| 2026-02-13 | 13F | Van Eck Associates Corp | 77.228 | 91,47 | 6 | 66,67 | ||||
| 2026-02-13 | 13F | Ieq Capital, Llc | 6.181 | 12,14 | 444 | 7,25 | ||||
| 2026-04-24 | 13F | Root Financial Partners, LLC | 23 | 91,67 | 1 | |||||
| 2026-02-10 | 13F | Fideuram Asset Management (Ireland) dac | 2.839 | 186 | ||||||
| 2026-02-14 | 13F | Taikang Asset Management (Hong Kong) Co Ltd | 80.000 | 54,40 | 5.753 | 47,64 | ||||
| 2026-02-17 | 13F | Henry James International Management Inc. | 0 | -100,00 | 0 | |||||
| 2026-02-12 | 13F | Skopos Labs, Inc. | 18.461 | 393,61 | 1.340 | 511,87 | ||||
| 2026-02-17 | 13F | Point72 Asset Management, L.P. | 66.766 | 4.801 | ||||||
| 2026-02-17 | 13F | Point72 Asset Management, L.P. | Call | 21.000 | 0,00 | 1.510 | -4,37 | |||
| 2026-01-30 | 13F | Mizuho Securities Co. Ltd. | 66.740 | 5,33 | 4.799 | 0,71 | ||||
| 2025-11-14 | 13F | Axa S.a. | 0 | -100,00 | 0 | |||||
| 2026-02-10 | 13F | Quantbot Technologies LP | 404 | -93,64 | 29 | -93,92 | ||||
| 2026-04-07 | 13F | Signaturefd, Llc | 9.286 | 0,61 | 462 | -30,32 | ||||
| 2026-02-11 | 13F | Prudential Plc | 12.531 | 46,75 | 901 | 40,34 | ||||
| 2026-02-12 | 13F | CIBC Private Wealth Group, LLC | 796.100 | 4,70 | 57.248 | 0,12 | ||||
| 2026-04-24 | 13F | Strs Ohio | 55.644 | -36,07 | 2.771 | -55,74 | ||||
| 2026-04-08 | 13F | Legacy Wealth Asset Management, LLC | 13.333 | 47,16 | 664 | 1,84 | ||||
| 2026-04-06 | 13F | GAMMA Investing LLC | 39 | 0,00 | 2 | -50,00 | ||||
| 2026-02-17 | 13F | Tudor Investment Corp Et Al | Call | 0 | -100,00 | 0 | -100,00 | |||
| 2026-02-12 | 13F | Sit Investment Associates Inc | 7.225 | 0,00 | 1 | |||||
| 2026-02-13 | 13F | Thornburg Investment Management Inc | 176.758 | -2,83 | 12.711 | -7,08 | ||||
| 2026-02-12 | 13F | Quadrant Capital Group Llc | 31.741 | -0,49 | 2.282 | -4,84 | ||||
| 2026-04-20 | 13F | Ronald Blue Trust, Inc. | 235 | -3,29 | 12 | -35,29 | ||||
| 2026-02-04 | 13F | C WorldWide Group Holding A/S | 613.469 | -16,35 | 44 | -20,00 | ||||
| 2026-02-09 | 13F | Fisher Asset Management, LLC | 2.431.248 | -3,20 | 174.831 | -7,44 | ||||
| 2026-02-17 | 13F | Ardmore Road Asset Management LP | 0 | -100,00 | 0 | |||||
| 2026-02-11 | 13F | Parallel Advisors, LLC | 5.762 | 33,04 | 414 | 27,38 | ||||
| 2026-02-17 | 13F | Elequin Capital Lp | 449 | 32 | ||||||
| 2026-02-13 | 13F | Squarepoint Ops LLC | Put | 53.600 | -4,96 | 3.854 | -9,13 | |||
| 2026-02-13 | 13F | Bridgefront Capital, LLC | 10.903 | 238,50 | 784 | 223,97 | ||||
| 2026-02-13 | 13F | Squarepoint Ops LLC | 3.876 | -20,66 | 279 | -24,25 | ||||
| 2026-04-17 | 13F | AdvisorNet Financial, Inc | 0 | -100,00 | 0 | |||||
| 2026-04-22 | 13F | Pictet Asset Management Holding SA | 73.697 | 0,00 | 3.669 | -30,76 | ||||
| 2026-02-17 | 13F | Delaware Management Holdings, Inc. | 870.137 | 62.571 | ||||||
| 2025-11-14 | 13F | Binnacle Investments Inc | 118 | 0,00 | 9 | 33,33 | ||||
| 2026-02-03 | 13F | AnglePoint Asset Management Ltd | 31.999 | 0,00 | 2.301 | -4,36 | ||||
| 2026-02-11 | 13F | Capital International Ltd /ca/ | 371.377 | -23,68 | 26.706 | -27,02 | ||||
| 2026-02-17 | 13F | Fred Alger Management, Llc | 9.492 | -94,29 | 683 | -94,54 | ||||
| 2026-02-17 | 13F | SummitTX Capital, L.P. | 9.659 | 695 | ||||||
| 2026-02-10 | 13F | Eurizon Capital SGR S.p.A. | 6 | 0 | ||||||
| 2026-02-10 | 13F | Jupiter Asset Management Ltd | 65.484 | -1,53 | 4.709 | -5,84 | ||||
| 2026-02-10 | 13F | Td Asset Management Inc | 36.340 | 25,45 | 2.613 | 19,97 | ||||
| 2026-02-17 | 13F | Maytus Capital Management, LLC | 0 | -100,00 | 0 | |||||
| 2026-02-17 | 13F | SageView Advisory Group, LLC | 100 | 7 | ||||||
| 2026-02-17 | 13F | Boothbay Fund Management, Llc | 3.100 | 223 | ||||||
| 2026-02-06 | 13F | Abn Amro Investment Solutions | 257.971 | 191,05 | 18.551 | 178,32 | ||||
| 2026-02-11 | 13F | Cerity Partners LLC | 17.539 | 3,73 | 1.261 | -0,79 | ||||
| 2025-11-12 | 13F | Victory Capital Management Inc | 0 | -100,00 | 0 | |||||
| 2026-04-24 | 13F | Key FInancial Inc | 265 | 0,00 | 13 | -31,58 | ||||
| 2026-02-11 | 13F | West Family Investments, Inc. | 6.192 | 0,00 | 445 | -4,30 | ||||
| 2026-02-12 | 13F | Brown Brothers Harriman & Co | 398 | 237,29 | 29 | 250,00 | ||||
| 2026-02-03 | 13F | Ballentine Partners, LLC | 9.379 | 9,59 | 674 | 4,82 | ||||
| 2026-02-12 | 13F | Principal Securities, Inc. | 0 | -100,00 | 0 | -100,00 | ||||
| 2026-02-13 | 13F | Transamerica Financial Advisors, Inc. | 6 | 0 | ||||||
| 2026-02-17 | 13F | Liontrust Investment Partners LLP | 87.610 | -34,10 | 6.300 | -36,97 | ||||
| 2026-02-13 | 13F | Smartleaf Asset Management LLC | 2.882 | 10,89 | 208 | 5,58 | ||||
| 2026-02-10 | 13F | Acadian Asset Management Llc | 128.163 | 0,00 | 9 | 0,00 | ||||
| 2026-02-06 | 13F | True Light Capital Pte. Ltd. | 373.751 | 26.876 | ||||||
| 2026-02-17 | 13F | Jones Financial Companies Lllp | 496 | -41,92 | 36 | -45,31 | ||||
| 2026-02-17 | 13F | Advisory Services Network, LLC | 6.999 | -0,04 | 503 | -4,37 | ||||
| 2026-02-09 | 13F | Intermede Investment Partners Ltd | 1.065.153 | -3,80 | 77 | -8,43 | ||||
| 2025-11-13 | 13F | FIL Ltd | 0 | -100,00 | 0 | |||||
| 2026-04-20 | 13F | Jfs Wealth Advisors, Llc | 230 | 0,00 | 11 | -31,25 | ||||
| 2026-02-06 | 13F | EverSource Wealth Advisors, LLC | 909 | 15,80 | 65 | 10,17 | ||||
| 2026-02-13 | 13F | Caxton Associates Llp | 12.734 | -9,99 | 916 | -13,92 | ||||
| 2026-01-27 | 13F | TD Waterhouse Canada Inc. | 1.029 | -16,07 | 74 | -19,78 | ||||
| 2026-02-02 | 13F | Advisors Preferred, LLC | 866 | 65 | ||||||
| 2026-02-17 | 13F | Susquehanna International Group, Llp | Call | 746.600 | -20,11 | 53.688 | -23,60 | |||
| 2026-02-17 | 13F | Susquehanna International Group, Llp | 18.418 | 371,17 | 1.324 | 351,88 | ||||
| 2026-02-17 | 13F | Driehaus Capital Management Llc | 1.072.741 | 4,98 | 77.141 | 0,38 | ||||
| 2026-04-24 | 13F | Deltec Asset Management Llc | 5.500 | 0,00 | 274 | -30,89 | ||||
| 2026-02-17 | 13F | Susquehanna International Group, Llp | Put | 368.300 | -3,38 | 26.484 | -7,61 | |||
| 2026-02-18 | 13F | Mackenzie Financial Corp | 137.440 | -0,05 | 9.920 | -4,06 | ||||
| 2026-02-17 | 13F | Magnetar Financial LLC | 924 | 66 | ||||||
| 2026-02-13 | 13F | Dynamic Technology Lab Private Ltd | 0 | -100,00 | 0 | |||||
| 2026-02-13 | 13F | Sequoia China Equity Partners (Hong Kong) Ltd | 0 | -100,00 | 0 | |||||
| 2025-10-30 | 13F | Twin Peaks Wealth Advisors, LLC | 0 | -100,00 | 0 | |||||
| 2026-02-13 | 13F | Pinnacle Wealth Planning Services, Inc. | 483 | 35 | ||||||
| 2026-02-12 | 13F | Cowa, Llc | 3.361 | 242 | ||||||
| 2025-11-14 | 13F | Cubist Systematic Strategies, LLC | Call | 0 | -100,00 | 0 | -100,00 | |||
| 2026-04-14 | 13F | Nbc Securities, Inc. | 9.177 | 70.492,31 | 457 | |||||
| 2026-02-10 | 13F | Norges Bank | 164.868 | 11.856 | ||||||
| 2026-02-11 | 13F | Capital Group Investment Management Pte. Ltd. | 79.189 | -24,01 | 5.694 | -27,34 | ||||
| 2026-02-13 | 13F | Pathstone Holdings, LLC | 19.976 | 2,94 | 1.436 | -1,58 | ||||
| 2025-11-13 | 13F | Connor, Clark & Lunn Investment Management Ltd. | 0 | -100,00 | 0 | |||||
| 2026-02-11 | 13F | Simplex Trading, Llc | 9.268 | -56,37 | 666 | 66.500,00 | ||||
| 2026-02-17 | 13F | Quantitative Investment Management, LLC | 0 | -100,00 | 0 | |||||
| 2026-02-05 | 13F | Bessemer Group Inc | 32 | 0,00 | 0 | |||||
| 2026-02-10 | 13F/A | Northwestern Mutual Wealth Management Co | 4.094 | 11,58 | 294 | 6,91 | ||||
| 2026-02-11 | 13F | Simplex Trading, Llc | Call | 54.300 | -27,89 | 3.905 | 77.980,00 | |||
| 2026-02-17 | 13F | Temasek Holdings (Private) Ltd | 2.239.671 | 67,11 | 161.055 | 59,80 | ||||
| 2026-02-05 | 13F | WIM INVESTMENT MANAGEMENT Ltd | 258.550 | 0,00 | 18.592 | -4,37 | ||||
| 2026-04-06 | 13F | Highline Wealth Partners Llc | 5 | 0,00 | 0 | |||||
| 2025-11-14 | 13F | Maxi Investments CY Ltd | 0 | -100,00 | 0 | |||||
| 2026-02-12 | 13F | Jane Street Group, Llc | Call | 254.100 | 4,22 | 18.272 | -0,33 | |||
| 2026-02-12 | 13F | Jane Street Group, Llc | 623.566 | -19,76 | 44.841 | -23,27 | ||||
| 2026-02-12 | 13F | Jane Street Group, Llc | Put | 345.600 | -8,40 | 24.852 | -12,41 | |||
| 2026-02-20 | 13F | Sunbelt Securities, Inc. | 52 | 0,00 | 4 | 0,00 | ||||
| 2026-02-17 | 13F | Anson Funds Management LP | 10.000 | 0,00 | 719 | -4,39 | ||||
| 2026-02-19 | 13F | Invesco Ltd. | 374.459 | 11,44 | 26.927 | 6,57 | ||||
| 2026-04-21 | 13F | Aaron Wealth Advisors LLC | 9.462 | 67,65 | 471 | 16,30 | ||||
| 2026-02-17 | 13F | Cetera Investment Advisers | 19.898 | 3,51 | 1.431 | -1,04 | ||||
| 2026-02-06 | 13F | Larson Financial Group LLC | 85 | -32,00 | 6 | -33,33 | ||||
| 2026-01-23 | 13F | Westside Investment Management, Inc. | 137 | 0,00 | 10 | 0,00 | ||||
| 2026-02-12 | 13F | Federated Hermes, Inc. | 1.621.454 | 6,46 | 116.599 | 1,80 | ||||
| 2026-02-17 | 13F | Blackstone Group Inc | 0 | -100,00 | 0 | |||||
| 2025-11-12 | 13F | APG Asset Management N.V. | 0 | -100,00 | 0 | |||||
| 2025-11-12 | 13F | Picton Mahoney Asset Management | 0 | -100,00 | 0 | |||||
| 2026-02-03 | 13F | Sequoia Financial Advisors, LLC | 15.111 | 2,67 | 1.087 | -1,81 | ||||
| 2026-02-17 | 13F | Financial Avengers, Inc. | 150 | 0,00 | 11 | 0,00 | ||||
| 2026-02-13 | 13F | OMERS ADMINISTRATION Corp | 12.489 | 15,11 | 898 | 10,18 | ||||
| 2026-02-06 | 13F | Gsa Capital Partners Llp | 19.970 | -50,71 | 1 | -66,67 | ||||
| 2026-04-22 | 13F | APEIRON CAPITAL Ltd | 70.000 | 3.485 | ||||||
| 2026-01-16 | 13F | Empirical Financial Services, LLC d.b.a. Empirical Wealth Management | 7.227 | 37,71 | 520 | 31,73 | ||||
| 2026-02-09 | 13F | AIA Group Ltd | 133.765 | -41,34 | 9.619 | -43,91 | ||||
| 2026-02-17 | 13F | Blair William & Co/il | 5.352 | 5,09 | 385 | 0,52 | ||||
| 2026-01-28 | 13F | Financial Perspectives, Inc | 434 | 0,00 | 31 | -3,12 | ||||
| 2026-02-10 | 13F | Green Court Capital Management Ltd | 426.108 | 0,00 | 29.793 | -7,02 | ||||
| 2026-04-23 | 13F | Fairman Group, LLC | 112 | 0,00 | 6 | -37,50 | ||||
| 2026-02-12 | 13F | XY Capital Ltd | 0 | -100,00 | 0 | |||||
| 2026-02-12 | 13F | New York State Common Retirement Fund | 509.324 | -28,47 | 36.625 | -31,60 | ||||
| 2026-04-22 | 13F | Spire Wealth Management | 100 | 0,00 | 5 | -42,86 | ||||
| 2026-02-06 | 13F | Handelsbanken Fonder AB | 412.000 | -2,37 | 30 | -6,45 | ||||
| 2026-01-26 | 13F | KBC Group NV | 166.651 | 0,27 | 12 | -8,33 | ||||
| 2026-02-17 | 13F | Fwl Investment Management, Llc | 0 | -100,00 | 0 | |||||
| 2026-02-19 | 13F/A | Headwater Capital Co Ltd | 325.000 | -12,16 | 23.371 | -16,01 | ||||
| 2026-02-13 | 13F | Stifel Financial Corp | 3.819 | 12,36 | 275 | 7,45 | ||||
| 2025-11-05 | 13F | BI Asset Management Fondsmaeglerselskab A/S | 0 | -100,00 | 0 | |||||
| 2026-02-10 | 13F | Parametrica Management Ltd | 16.100 | 1.158 | ||||||
| 2026-02-09 | 13F | Jefferies Financial Group Inc. | 0 | -100,00 | 0 | |||||
| 2026-01-15 | 13F | Frank, Rimerman Advisors LLC | 10.975 | 0,20 | 789 | -4,13 | ||||
| 2025-11-06 | 13F | Ameritas Advisory Services, LLC | 0 | -100,00 | 0 | |||||
| 2026-02-13 | 13F | Barclays Plc | Call | 22.900 | 0,00 | 1.647 | -4,41 | |||
| 2026-02-13 | 13F | Tairen Capital Ltd | 483.010 | 384,46 | 34.733 | 363,29 | ||||
| 2026-02-17 | 13F | Qube Research & Technologies Ltd | 325.865 | -38,68 | 23.433 | -41,36 | ||||
| 2025-11-07 | 13F | Sierra Ocean, Llc | 0 | -100,00 | 0 | |||||
| 2026-02-17 | 13F | Millennium Management Llc | Put | 32.200 | -58,88 | 2.316 | -60,68 | |||
| 2026-02-11 | 13F | Fox Run Management, L.l.c. | 5.920 | -72,45 | 426 | -73,68 | ||||
| 2026-02-17 | 13F | Millennium Management Llc | Call | 18.000 | -56,10 | 1.294 | -58,03 | |||
| 2026-01-30 | 13F | Flossbach Von Storch Ag | 45.000 | 0,00 | 3.236 | -4,40 | ||||
| 2026-02-17 | 13F | Millennium Management Llc | 210.104 | 47,37 | 15.109 | 40,92 | ||||
| 2026-02-18 | 13F | Wahed Invest LLC | 11.268 | 6,83 | 810 | 2,14 | ||||
| 2026-01-15 | 13F | Boston Common Asset Management, LLC | 335.934 | 104,12 | 24.157 | 95,19 | ||||
| 2026-02-13 | 13F | Gts Securities Llc | 35.586 | -67,53 | 2.559 | -68,96 | ||||
| 2026-02-10 | 13F | CIBC Asset Management Inc | 8.522 | 15,87 | 613 | 10,67 | ||||
| 2026-02-11 | 13F | Capital International Inc /ca/ | 425.722 | -8,57 | 30.614 | -12,57 | ||||
| 2026-02-17 | 13F | Fmr Llc | 3.316.420 | -52,25 | 238.484 | -54,34 | ||||
| 2026-02-05 | 13F | Td Private Client Wealth Llc | 433 | 31 | ||||||
| 2026-02-11 | 13F | IMA Wealth, Inc. | 37 | 3 | ||||||
| 2026-04-15 | 13F | Financial Management Professionals, Inc. | 57 | -76,35 | 3 | -88,24 | ||||
| 2025-12-15 | 13F/A | Hudson Bay Capital Management LP | 0 | -100,00 | 0 | -100,00 | ||||
| 2026-02-13 | 13F | Barclays Plc | Put | 60.000 | 0,00 | 4.315 | -4,39 | |||
| 2026-02-13 | 13F | Barclays Plc | 153.377 | 29,84 | 11.029 | 24,16 | ||||
| 2025-11-14 | 13F | Evelyn Partners Investment Management Services Ltd | 0 | -100,00 | 0 | |||||
| 2026-02-10 | 13F | PARUS FINANCE (UK) Ltd | 97.785 | 0,77 | 7.032 | -3,65 | ||||
| 2026-02-09 | 13F | Coldstream Capital Management Inc | 8.195 | -16,74 | 589 | -20,41 | ||||
| 2026-04-21 | 13F | Financial Consulate, Inc | 92 | 1.050,00 | 5 | |||||
| 2026-02-13 | 13F | Evelyn Partners Asset Management Ltd | 4.912 | 0,00 | 353 | -4,34 | ||||
| 2026-02-03 | 13F | Crossmark Global Holdings, Inc. | 37.776 | 1,47 | 2.716 | -2,97 | ||||
| 2026-02-17 | 13F | Nomura Holdings Inc | 70.116 | 59,75 | 5.042 | 52,79 | ||||
| 2026-02-11 | 13F | Group One Trading, L.p. | Call | 189.200 | 4,13 | 13.605 | -0,42 | |||
| 2026-04-21 | 13F | Vise Technologies, Inc. | 7.699 | 0,00 | 554 | 0,00 | ||||
| 2026-02-06 | 13F | Leonteq Securities AG | 11.123 | 9,38 | 800 | 4,58 | ||||
| 2026-02-10 | 13F | AdvisorShares Investments LLC | 2.294 | 17,82 | 165 | 12,33 | ||||
| 2026-02-17 | 13F | Citadel Advisors Llc | Put | 158.000 | 30,69 | 11.362 | 24,97 | |||
| 2026-02-17 | 13F | Citadel Advisors Llc | Call | 97.400 | -30,58 | 7.004 | -33,61 | |||
| 2026-02-02 | 13F | Fifth Third Bancorp | 290 | 346,15 | 21 | 400,00 | ||||
| 2026-02-06 | 13F | Pnc Financial Services Group, Inc. | 7.989 | -0,55 | 575 | -4,97 | ||||
| 2026-01-23 | 13F | Hardman Johnston Global Advisors LLC | 5.750 | 0,00 | 413 | -4,40 | ||||
| 2026-02-17 | 13F | Citadel Advisors Llc | 940.771 | 181,64 | 67.651 | 169,32 | ||||
| 2026-02-17 | 13F | Limestone Investment Advisors LP | 44.600 | 0,00 | 3.207 | -4,35 | ||||
| 2026-04-21 | 13F | Robeco Institutional Asset Management B.V. | 2.611.584 | 155,53 | 130.031 | 76,93 | ||||
| 2026-04-23 | 13F | Analyst IMS Investment Management Services Ltd. | 36.900 | 0,00 | 2 | -50,00 | ||||
| 2026-01-23 | 13F | Lester Murray Antman dba SimplyRich | 8.464 | -18,73 | 1 | |||||
| 2026-02-11 | 13F | Harvest Fund Management Co., Ltd | 90.000 | 0,00 | 6 | 0,00 | ||||
| 2026-02-13 | 13F | Marshall Wace, Llp | Call | 0 | -100,00 | 0 | ||||
| 2026-02-17 | 13F | Schonfeld Strategic Advisors LLC | 13.432 | -61,71 | 966 | -63,42 | ||||
| 2026-02-17 | 13F | DV Trading LLC | 8 | 1 | ||||||
| 2025-11-13 | 13F | Clear Street Markets Llc | 0 | -100,00 | 0 | -100,00 |